How Hotjar as an analytical tool will help you achieve more conversions
With Hotjar you can directly involve users and receive feedback using various tools.
With analysis for project success
The first impression counts and is usually correct. A person needs almost a tenth of a second to do this. The human attention span, which was just under nine seconds a few years ago, delivers similar results. The trend is falling rapidly.
The cause is obvious: the sharp increase in media consumption in recent years. Laptops, tablets, cell phones, social media platforms, news, gadget here, gadget there – we are in the information age. Stimuli are everywhere, almost unavoidable and exist in a wide variety of forms of representation - above all virtual.
Stimuli activate purchasing processes.
Key stimuli play a significant role, especially in marketing, because they activate purchasing processes. This is followed by emotional and cognitive processes, considerations of inner attitudes, attitudes and motivational factors. The abundance of variables to be weighed suggests that a purchasing process cannot take place within a few seconds. I am not yet aware of a way to comprehensively analyze human purchasing behavior. People are simply too different for that and individual decision-making processes are too complex (according to selected studies, up to 100,000 decisions per day - without having to think about it much. Around 90 percent of decisions are made unconsciously). Taking all factors into account tends to be...difficult, to put it politically.
Listen to your gut feeling.
It is unlikely that everything can be measured. In my opinion, this is a situation that will change as our information and IT age progresses. Without guarantee and above all without specifying a time.
Target group
But let's get back to the here and now: How do we get in-depth insight into what moves my audience? How do we manage to inspire people and bind them to our product? Where do visitors to our platform/product see hurdles and why do they drop out? To put it briefly:
What thinks and moves my target group?
There are numerous ways to influence the purchasing process in your favor. How and where influences make sense is usually a matter of experience - and this experience largely comes from the analysis of suitable measured values.
If we want to optimize a process, then I understand the human counterpart with all their needs and the resulting actions as the basis of this process. Here we find the first starting point. The natural monopoly “Google” has done a great job. The search algorithm is constantly being developed.
User data as the basis for international success
Data that helped Google become a global player. Google Analytics, for example, is one such service that can provide frequented platforms with information about optimization potential. Anyone who deals with Google Analytics for the first time will notice that the abundance of data can quickly lead to disinterest. In order to exploit the full potential of the extensive tracking options, you should plan some time for functions and research. Last but not least, a number of training courses are currently being offered and are well attended.
Google Analytics provides data about demographics, language, hardware, user behavior (clicks, dwell, bounce, keywords) and much more. The service offers extensive evaluation options, optimization recommendations and is also free of charge (not entirely altruistic). The question is of course legitimate: So why is Hotjar?
User research
Hotjar should not be viewed as an alternative or competitor, but rather as a complement. While Google's Analytics service provides, among other things, an overall overview of the behavioral flow of all visitors to a platform, Hotjar specializes in the individual and his behavior as a user.
Hotjar supports you with user research
A common approach to optimizing frequented platforms is to break them down into smaller processes. A specific methodology is often used here. So-called use cases are based on the following question:
What should my planned system achieve?
The answer to this question is difficult to generalize because not every use case will satisfy the same needs. It's about creating the "ideal" interaction (there is of course a lot of room for interpretation) between man and machine (system). But when is such an interaction “ideal”?
The measured value of such an interaction is, among other things, conversion. Use cases are based on user research (and therefore experience) and therefore naturally generate innovative ideas. Such an “innovative idea” ideally simplifies the handling of the planned system. The easier, the more intuitive it is to use, the higher the probability of being used, the higher the added value for the user.
Common practice for testing innovative ideas involves complex procedures such as interviews/surveys, A/B strategies or eye tracking heatmaps.
Hotjar starts right here.
The range of functions of the online service includes recordings, heatmaps, funnels, forms, polls, surveys and recruiters.
Functional scope: Heatmaps
The graphical interface of the service is very clear and intuitive to use. That's exactly why Hotjar is so much fun. Without having to invest deeply in the professional jargon and without complicated configuration of the respective campaigns, Hotjar can be set up in just a few minutes, even for newcomers. To do this, analogous to Google Analytics, a tracking script with a specific ID is integrated into the index file of the relevant website/application.
The Hotjar site dashboard (the sidebar) houses every available feature in a structured and minimalist way, divided into two main areas: analysis and feedback.
Analysis includes features such as heatmaps and recordings, and feedback includes features such as polls and surveys. The minimalist representation makes it possible to quickly make a decision. In my first test run I decided to use heatmaps.
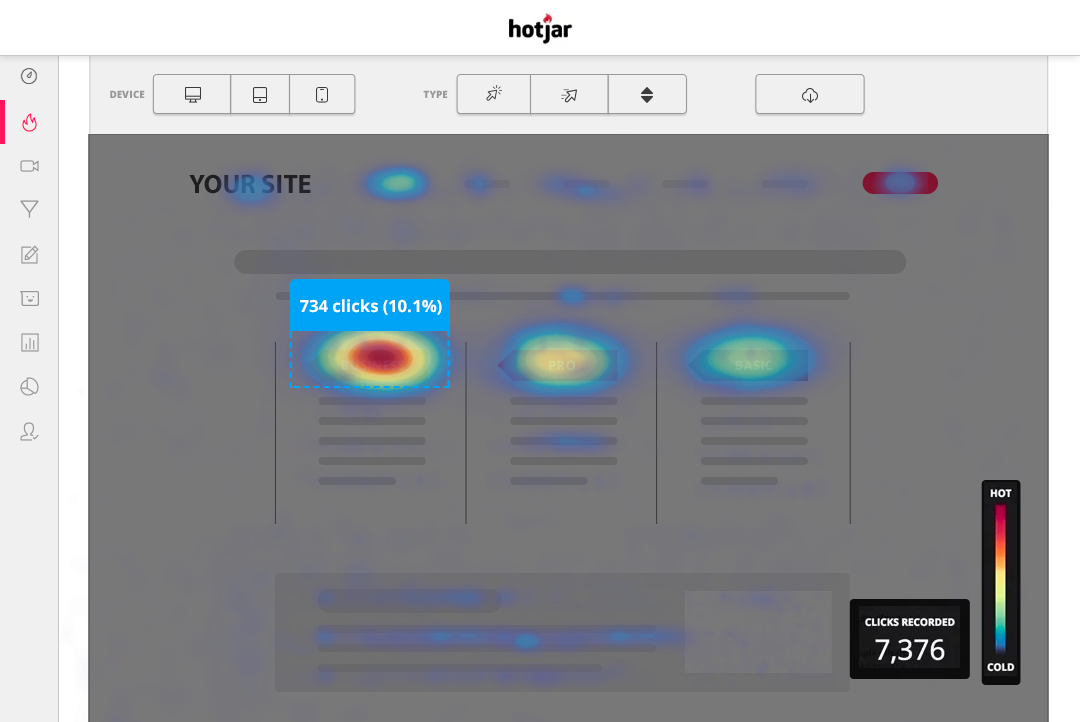
In contrast to eye tracking, Hotjar's heatmaps provide an overview of visitors' mouse movements. The color scale ranges from blue (little visited) to red (very often visited). You can sort by desktop or mobile visitors. When filtering, the heatmaps are adjusted accordingly.
You can also sort according to the following types: mouse click, mouse movement and mouse scroll.
You get a very clear overview of all the activities of visitors to the integrated page. The principle behind the Hotjar heatmaps is not entirely compatible with the principle of usual eye tracking methods. In contrast to the eye, which reacts very quickly to stimuli (such as a colored button), the visitor's reaction to the mouse is rather slow and can be influenced at will.
In an unnatural environment, the result can quickly become distorted. I believe that this can be neglected in practice. Above all, the mass provides actual information about areas that work well or less well.
What really impresses me is what's between the lines. Google Analytics provides information about what is clicked and what is not clicked by comparing the total number of visitors to a campaign with the click rate of a button/link or similar. However, you don't get direct feedback about why people aren't clicking and what's stopping the audience from clicking. Heatmaps provide information about what actually works (red, warm color areas) and what is neglected (blue, cold color areas).
You also get information about what could distract the visitor from the actual “click target” and whether all relevant information is actually available or whether additional information needs to be added to prevent the visitor from jumping off.
Is the content of interest to the visitor easy to find, or might this information need to be restructured?
Heatmaps also illustrate the optimization potential of the mobile version of the website/application in question. Is the layout restructured too much in mobile mode? Is information hidden that is also absolutely necessary on mobile devices? Are the information channels designed for desktop not close enough to each other for mobile purposes?
With intensive study and detailed analysis, the results of the heatmaps can raise questions that are worth answering in further rounds of optimization. Questions may even arise that have not yet been addressed.
Anyone who believes that this information is enough to draw attractive conclusions about user behavior may be right. However, Hotjar offers even more detailed feedback with the “Visitor Recordings” in order to understand visitors even better.
Related Articles